TL;DR – Raising Sentinel alerts for the new SSE events.
I know I am late to the game, since this solution was announced way back last month, but what can I say, I’ve been busy. This weekend I’ve been testing Microsoft’s Security Service Edge (SSE) solution. So, while I was having fun testing and learning, I thought some of these events should be raised as alerts within Sentinel. Maybe not an incident, but at least an informational alert that can be correlated with other alerts, especially in cases of multi-stage attacks. So, in this blog post, I will show you one possible alert, for now.
Notice the term SSE is used and not SASE (Secure Access Service Edge), that’s because SSE does not include an SD-WAN solution. Microsoft’s SSE solution includes the existing CASB (Cloud Access Security Broker), which of course is Microsoft Defender for Cloud Apps (MDCA), as well as the new services that were announced in July, Entra Internet Access, Private Access, and Universal Tenant Restrictions.
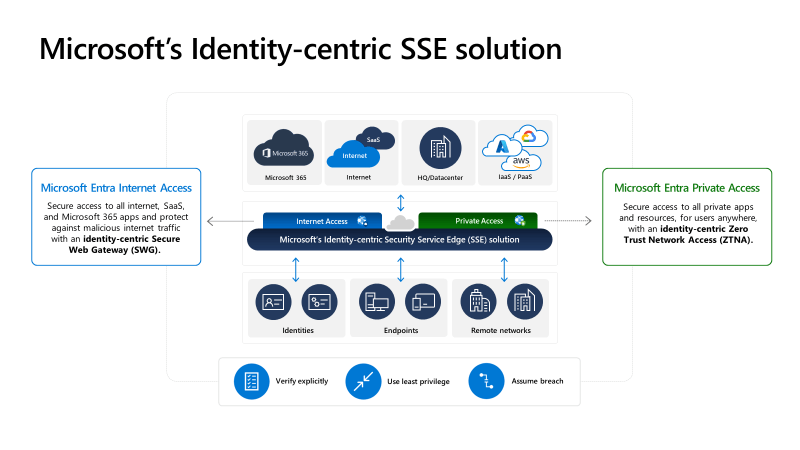
Entra Internet Access is an identity-centric Secure Web Gateway (SWG) solution, and Entra Private Access is an identity-centric Zero Trust Network Access (ZTNA) solution. Together, Entra’s Internet Access and Private Access together are known as Global Secure Access. By the way, if you want a deeper dive on these new services, there are two very thorough overview videos, one by John Craddock and one by John Savill, and both are fantastic.
Logging in progress
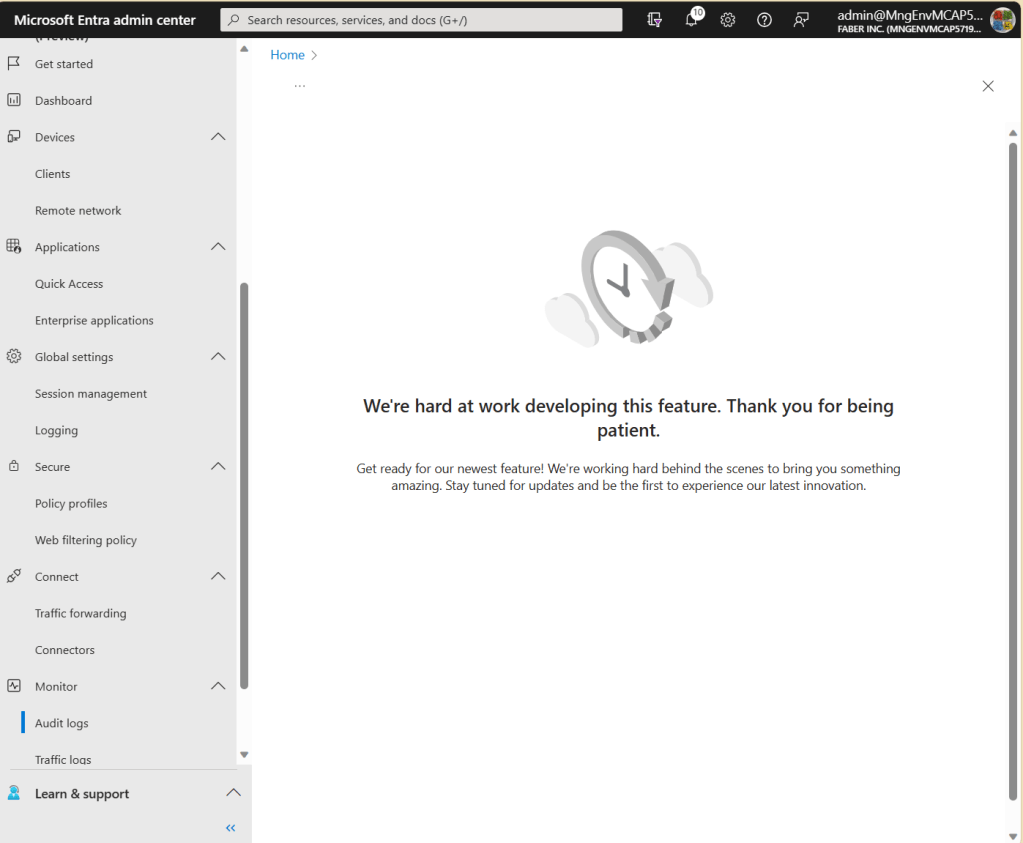
This post is about what is possible to alert on for now, because I can see new logging that is still in progress, as you can see below.
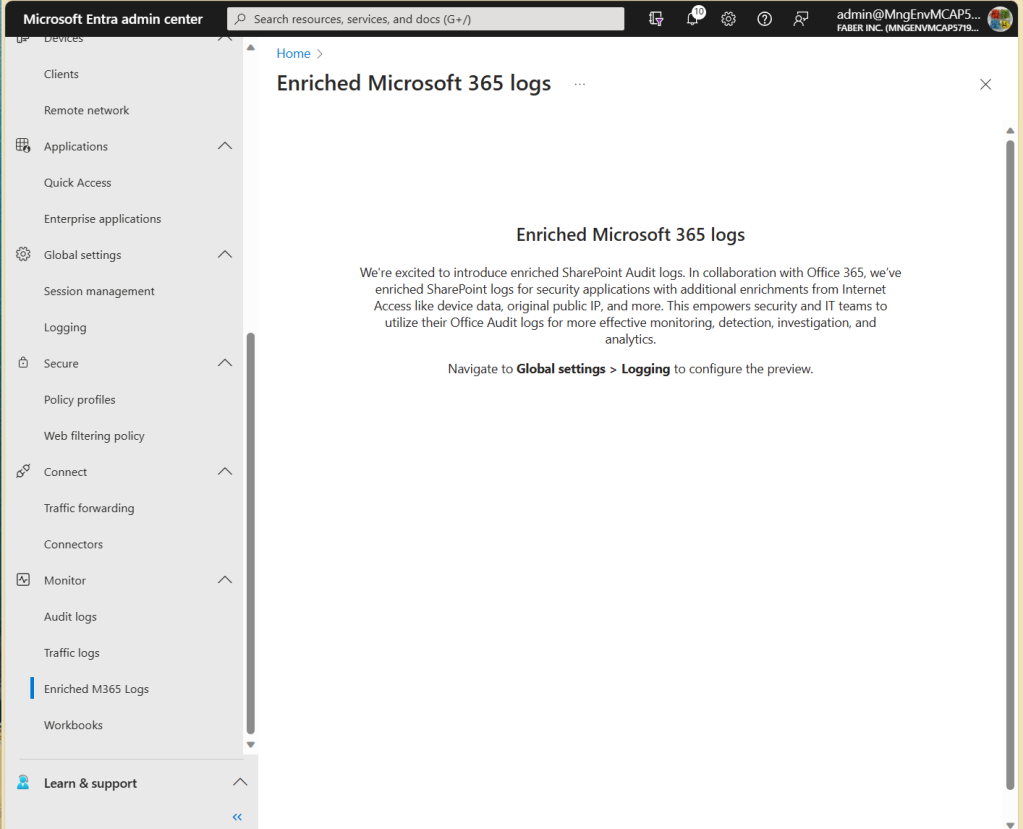
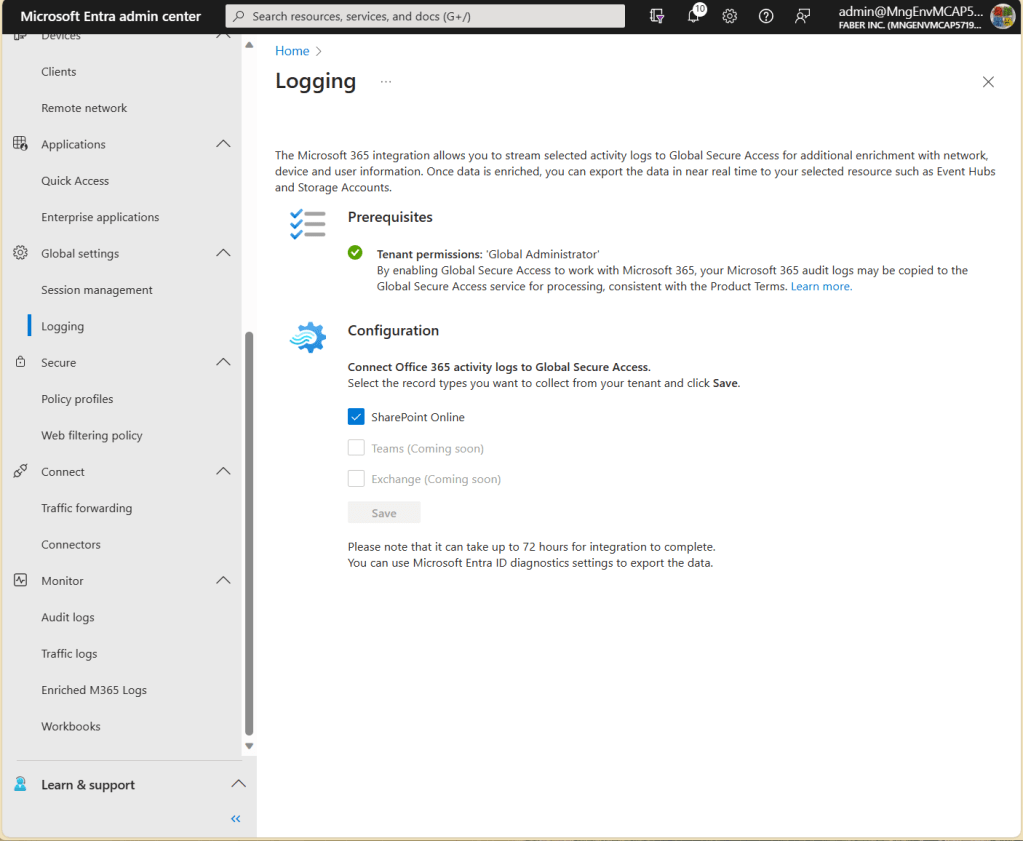
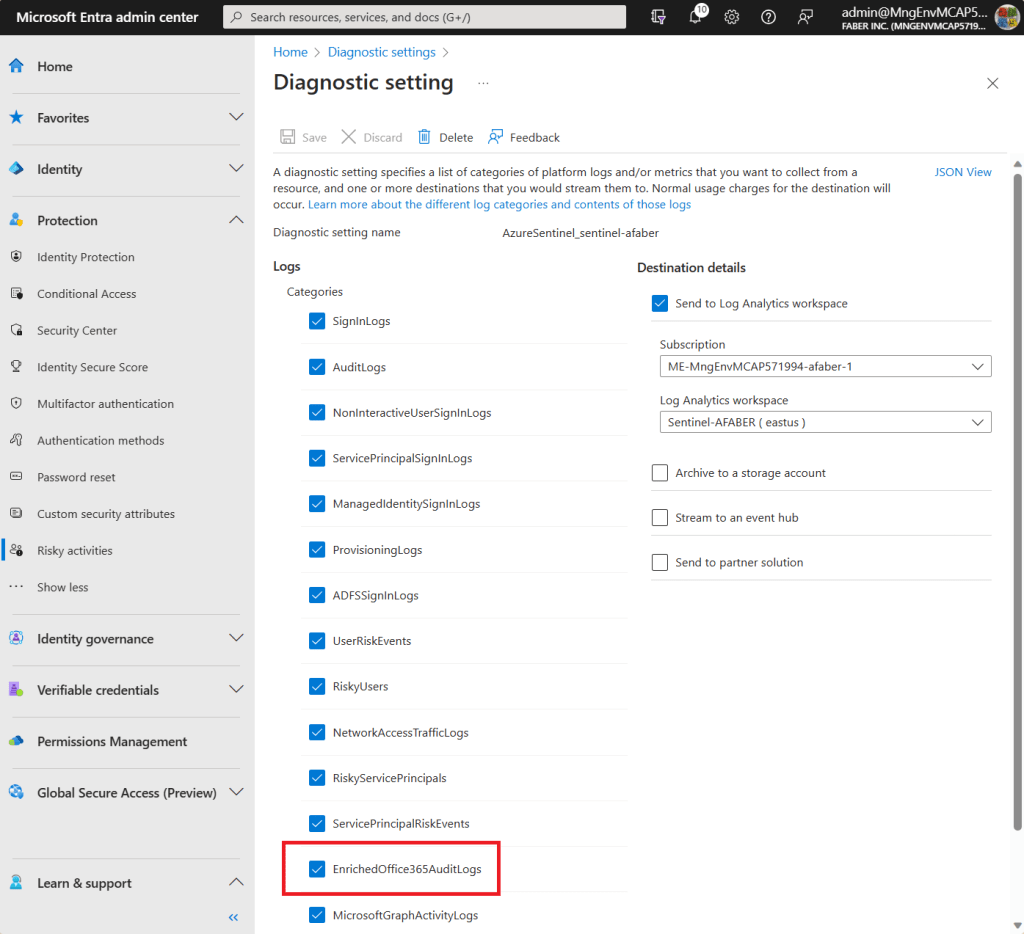
And also, there are Enriched Microsoft 365 logs, which I enabled, per the current instructions provided in the documentation.
And I also integrated the EnrichedOffice365AuditLogs with my Sentinel Log Analytics Workspace, as shown below.
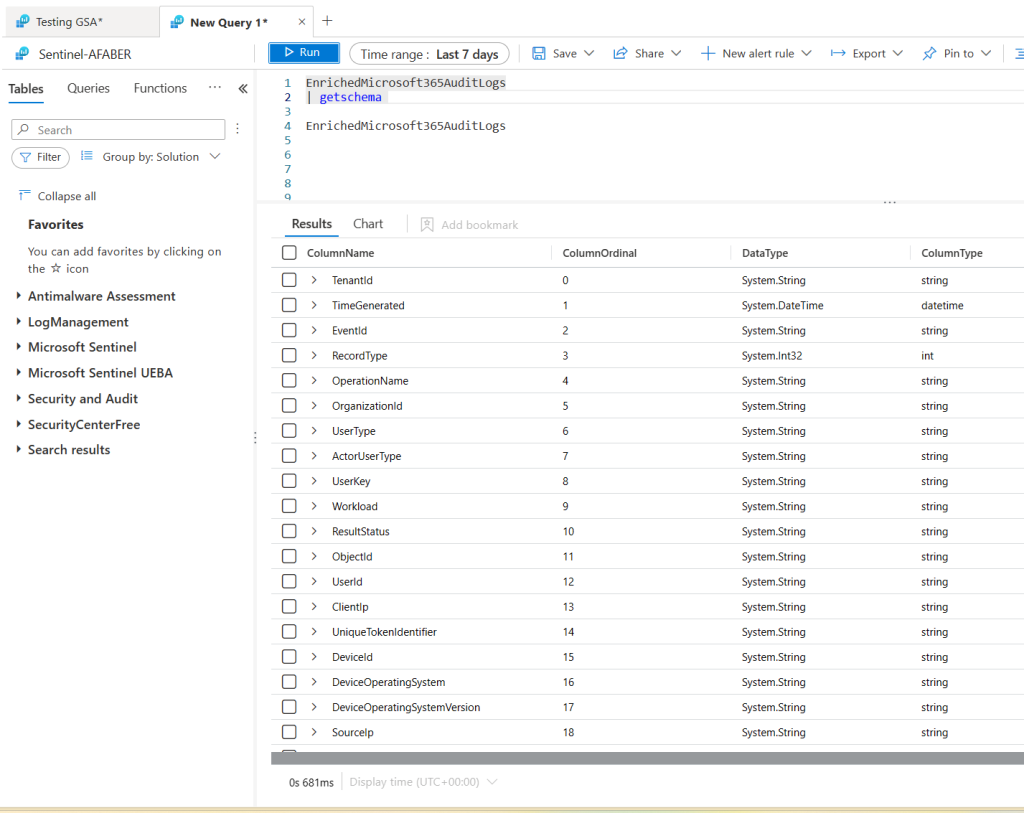
However, while I can see the table in Sentinel as you can see below, there’s still no data being ingested. So, what I am showing in this blog post is what I can surface for now. I hope in the future to add additional context, especially around the device, which is always helpful! By the way, the schema description for EnrichedOffice365AuditLogs can be found in the documentation.
SigninLogs and Universal Tenant Restrictions
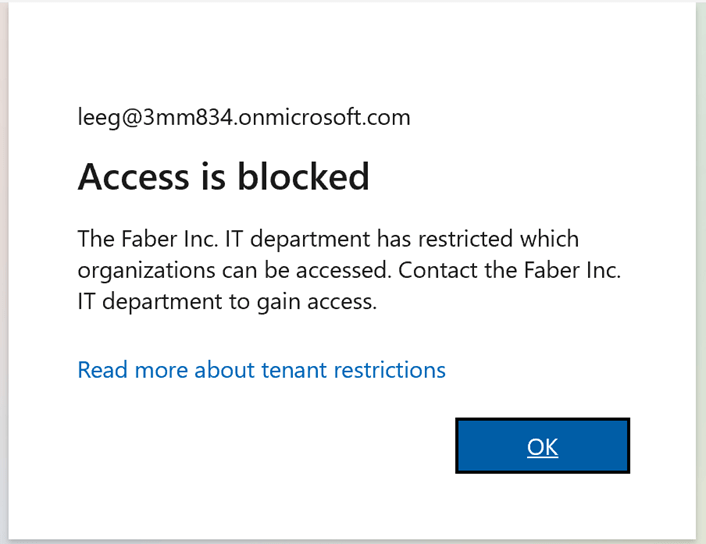
While I wait for the brilliant people to add more logging, I found some useful logging already in the SigninLogs table. This is especially useful to alert when someone is trying to connect to a restricted tenant from one of those endpoints with the GSA client enabled. In my tenant I only allow one external tenant to access specific data, so all others are considered restricted. This is part of the new features around Universal Tenant Restrictions, which blocks users from connecting to any restricted tenants to prevent data exfiltration to other tenants. When that happens, the user will see this error:
I went digging in the logs and found some useful bits, as shown below:
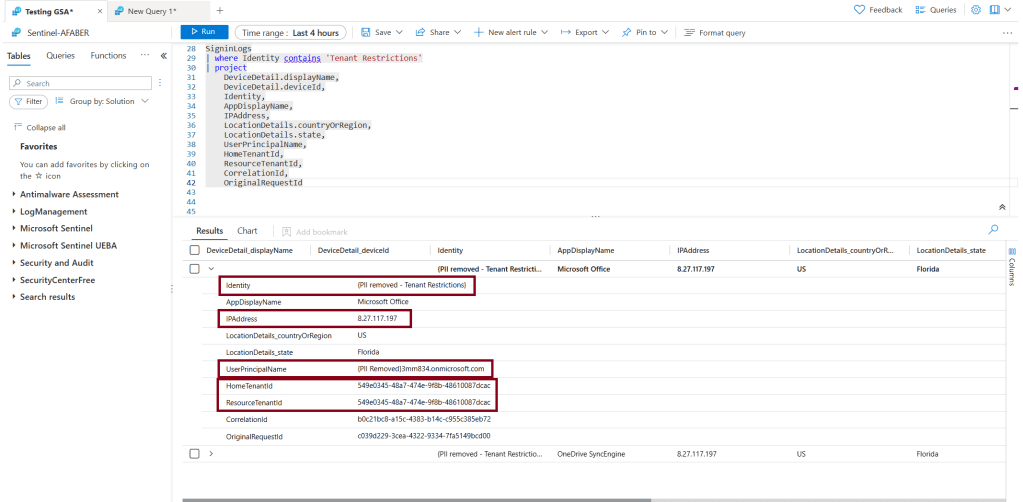
I can’t see the specific user they were trying to connect to (more on that later), but I can see the tenant name from the Identity value and the tenant ID, as well as the IP address that it originated from. Notice that DeviceDetail doesn’t show any data, which makes sense because it’s authenticating to a different tenant, but I hope that’s part of the future enrichment that is currently in progress. For now, knowing the tenant they are trying to connect to and the IP they are connecting from is still very useful.
This may not necessarily deserve an incident being created, but it may prove to be useful in the case of a multi-stage attack, so I created a simple analytic rule that will trigger an alert around that.
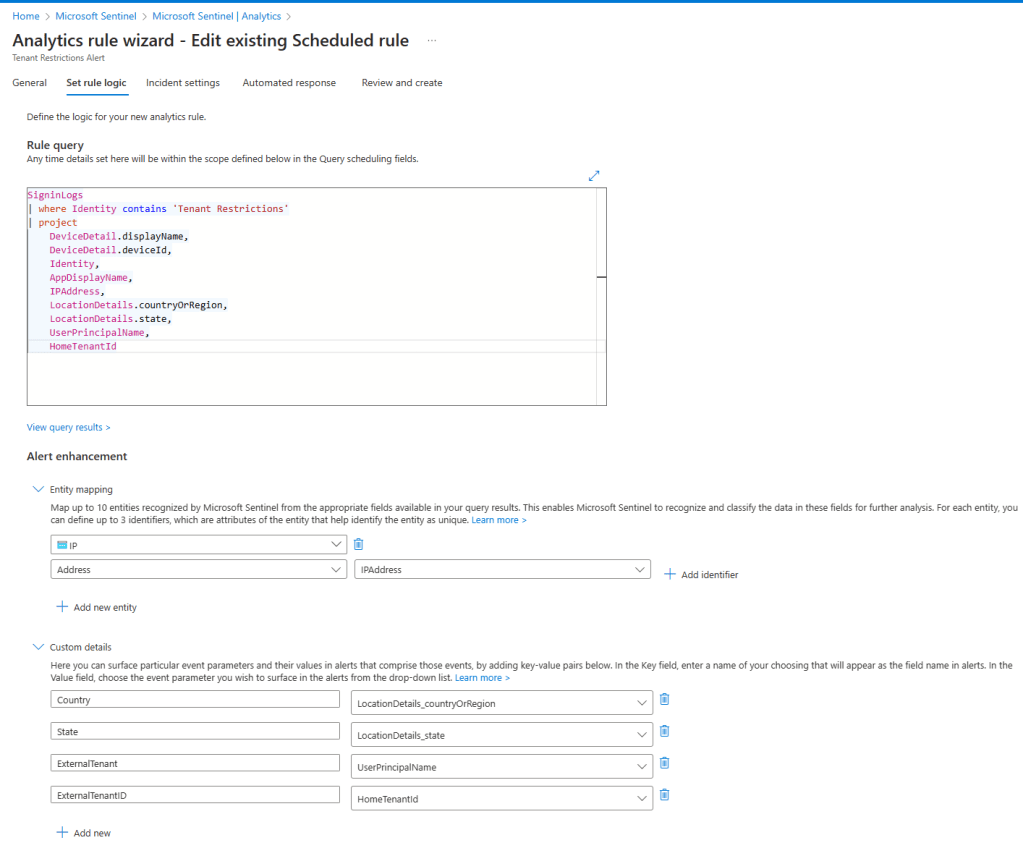
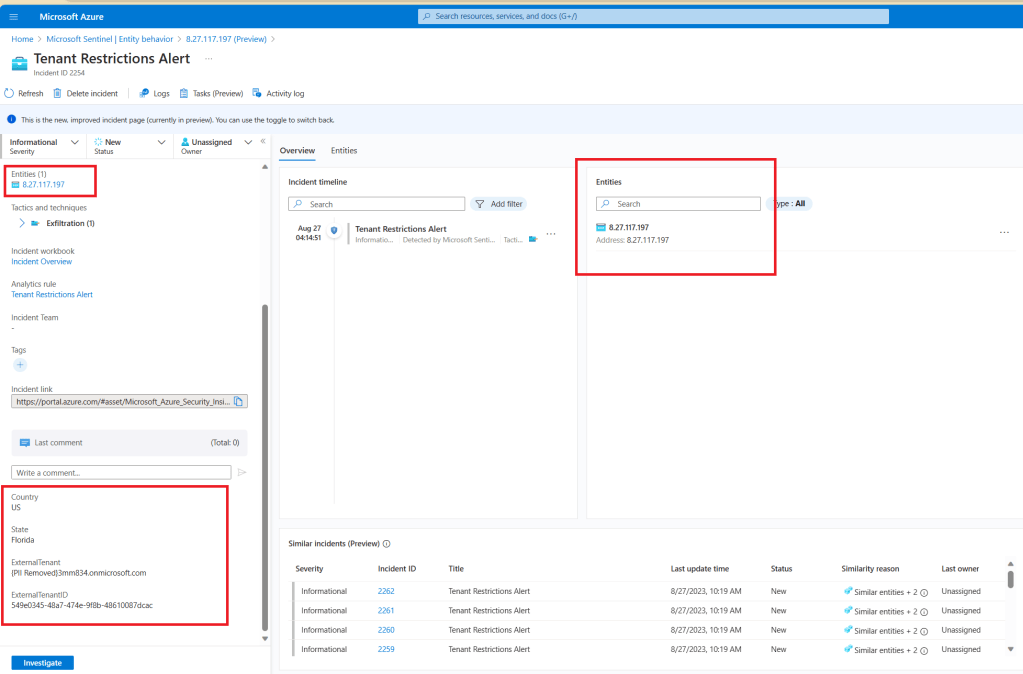
For my testing purposes, I am generating an incident, but normally an informational alert without an incident will be sufficient to just be able to correlate this alert within any Fusion multi-stage incidents or even Defender 365 incidents that are already correlated. If you remember, that correlation will work as long as the custom analytics rule contains kill-chain (tactics) and entity mapping information. As you can see above, I am only mapping the IPAddress for now, because that’s all I have, but I may expand this once the additional logging is available. I did add a few custom details for information that may also be useful to the SOC analyst, such as the tenant name they are trying to connect to and the associated tenant id. That information is surfaced through the incident as shown below.
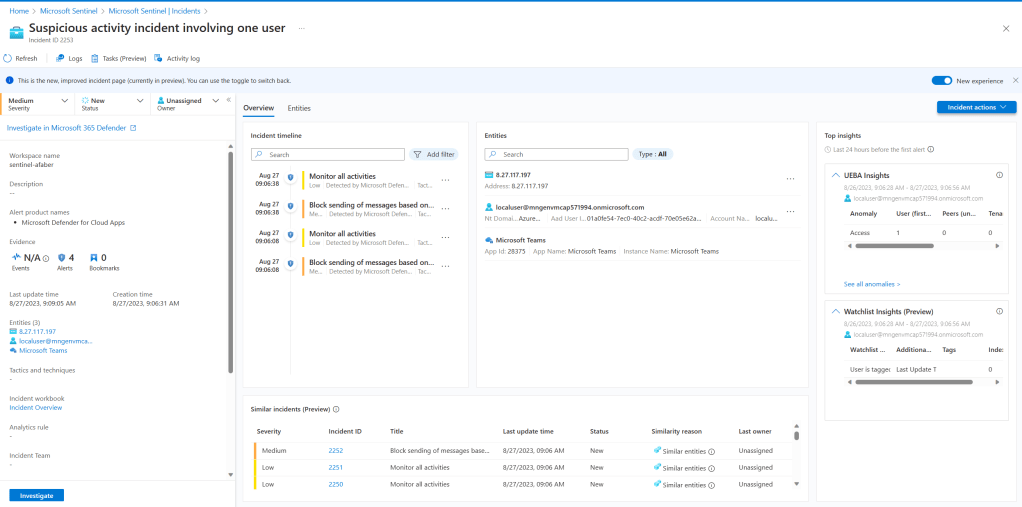
This is where I see this being useful. The IPAddress that I mapped to my incident is showing through other incidents. For example, this one:
When I go investigate that entity, I can get additional information, such as those other alerts on Tenant Restrictions, as shown below.
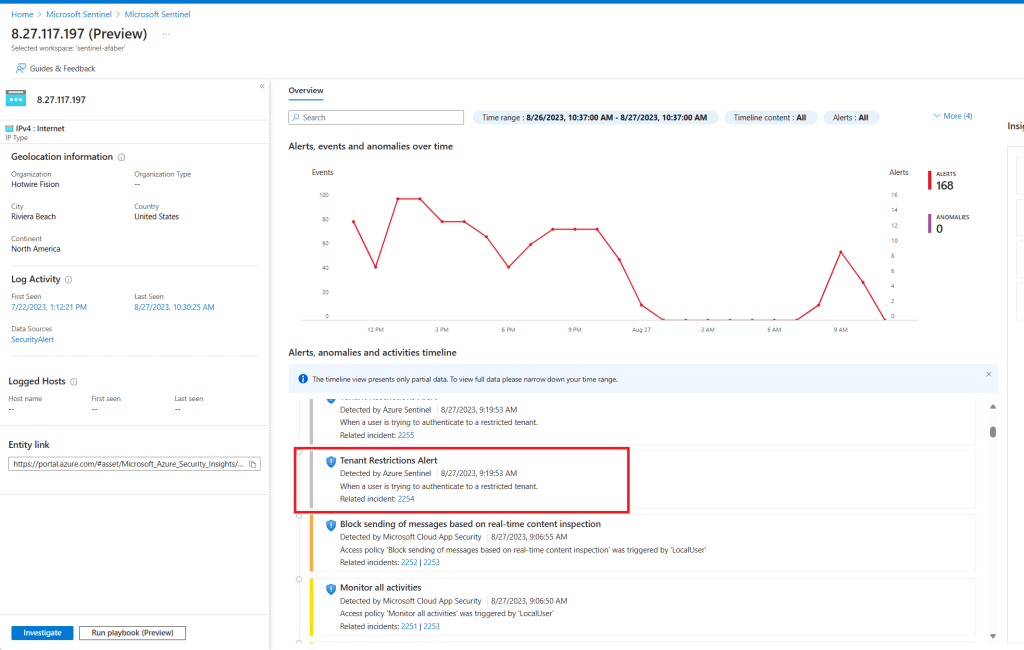
This is going to provide the SOC analyst additional information. Knowing that they were trying to connect to a restricted tenant, and even the specific tenant they were trying to connect to, may be useful information for that investigation.
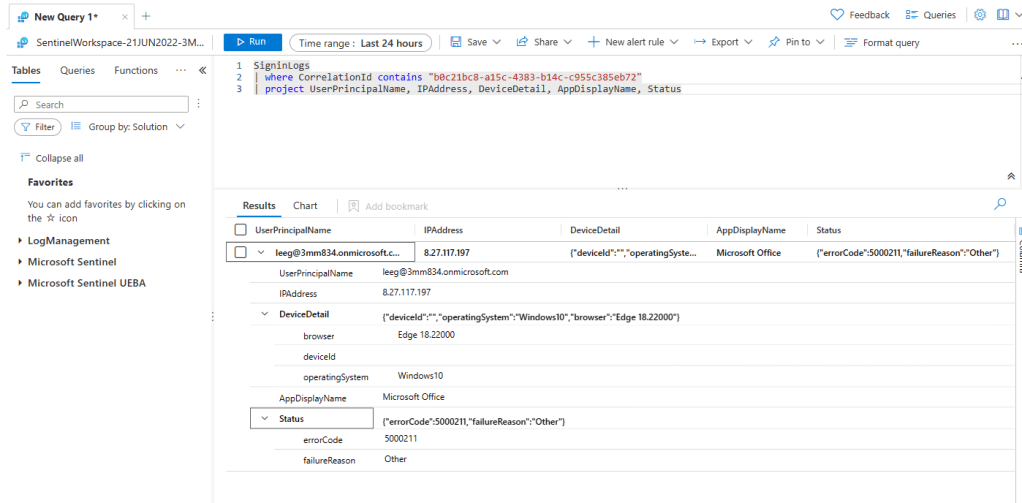
In case you are wondering, as I was, I can follow that correlation id to the tenant the user was trying to connect to and from there get additional details, as shown below, including the user.
Future
As additional information is added, as part of the future logging that is progress, I will continue to modify this scenario to include that information. If you haven’t tested the new SSE solution, I recommend you do. It’s pretty straight forward to configure and it really should be part of any Zero Trust solution our partners are currently offering. As usual, I hope this information is useful and happy testing!
